От халепа... Ця сторінка ще не має українського перекладу, але ми вже над цим працюємо!


iOS performance myths: why your app feels slow in 2026

Danylo Dyachok
/
iOS Developer
•
12 min read
Share:


Share:
•
12 min read
Your dashboards are green, Instruments looks clean, and users still say the app is slow. Here’s why the usual performance advice lies to you, and a feel-first way to find what actually hurts.
By Danylo Dyachok, iOS Developer at NERDZ LAB
In this article:
- Myth 1: A good average means a fast app
- Myth 2: If the metrics are green, it feels fast
- Myth 3: SwiftUI’s diffing is the bottleneck
- Myth 4: UIKit is deprecated
- Myth 5: Move it off the main thread and it’s fixed
- Myth 6: Instruments will show you the cause
- The refrain: performance is a UX contract, not a benchmark
- FAQ
- About the author
- How we approach this at NERDZ LAB
Performance used to be legible. You called reloadData, you configured a cell, you felt the cost in your hands. Now a single @State flip can wake half a screen, an SDK you didn’t write can add 200 ms to launch, and the profiler points at a symptom three layers away from the cause. The tools got better. The intuition got worse.
What follows is the version of that argument I’d make to a colleague over a bad office coffee: six myths I keep running into, and what I’ve come to believe after unlearning them. Here’s the short version.
| The myth | The reality |
|---|---|
| A good average means a fast app | The average is nobody’s experience. The tail is the product |
| Green metrics mean it feels fast | Users read the UI, not your dashboards |
| SwiftUI’s diffing is the bottleneck | Diffing is usually innocent. Unstable structure is the crime |
| UIKit is deprecated | UIKit still carries SwiftUI on iOS. It’s not going anywhere |
| Move it off the main thread and it’s fixed | The same CPUs still pay for the work |
| Instruments will show you the cause | Instruments shows you a scenario. Production is a different one |

Myth 1: A good average means a fast app
Is average FPS a good measure of app performance?
“58 FPS average. 300 ms median load. We’re fine.”
You’re not fine. An average is a summary of everyone, which makes it a description of no one. The users who churn aren’t sitting comfortably at the mean. They’re the tail: the 500 ms scroll freeze, the launch that takes two seconds on the tenth try, the P99 that’s four times worse than the number you quoted in standup.
So stop looking at the center and go look at the edges:
- Report P95 and P99, not just the mean. “200 ms average” routinely hides “800 ms at P99,” and those are two completely different stories about who you’re losing.
- Track frame pacing, not frame rate. A screen can average 58 FPS and still hitch, because what the hand notices is consistency rather than throughput.
- Measure to interaction, not to a lifecycle event. “Screen appeared” is not “user can act,” and the gap between those two moments is where the frustration actually lives.
In plain terms: Frame pacing is how consistent the interval between rendered frames is, usually reported as hitch rate. It is not the same thing as frame rate: a screen can average 58 FPS and still feel broken if a handful of frames arrive late. The hand notices consistency, not throughput.
The useful part: you probably already have this data. Xcode’s Organizer reports launch time, hangs and disk writes from real installs, broken out by percentile, and in most teams I’ve worked with nobody had opened that tab in months. Here is one shipping app, one release, one week, read two different ways.
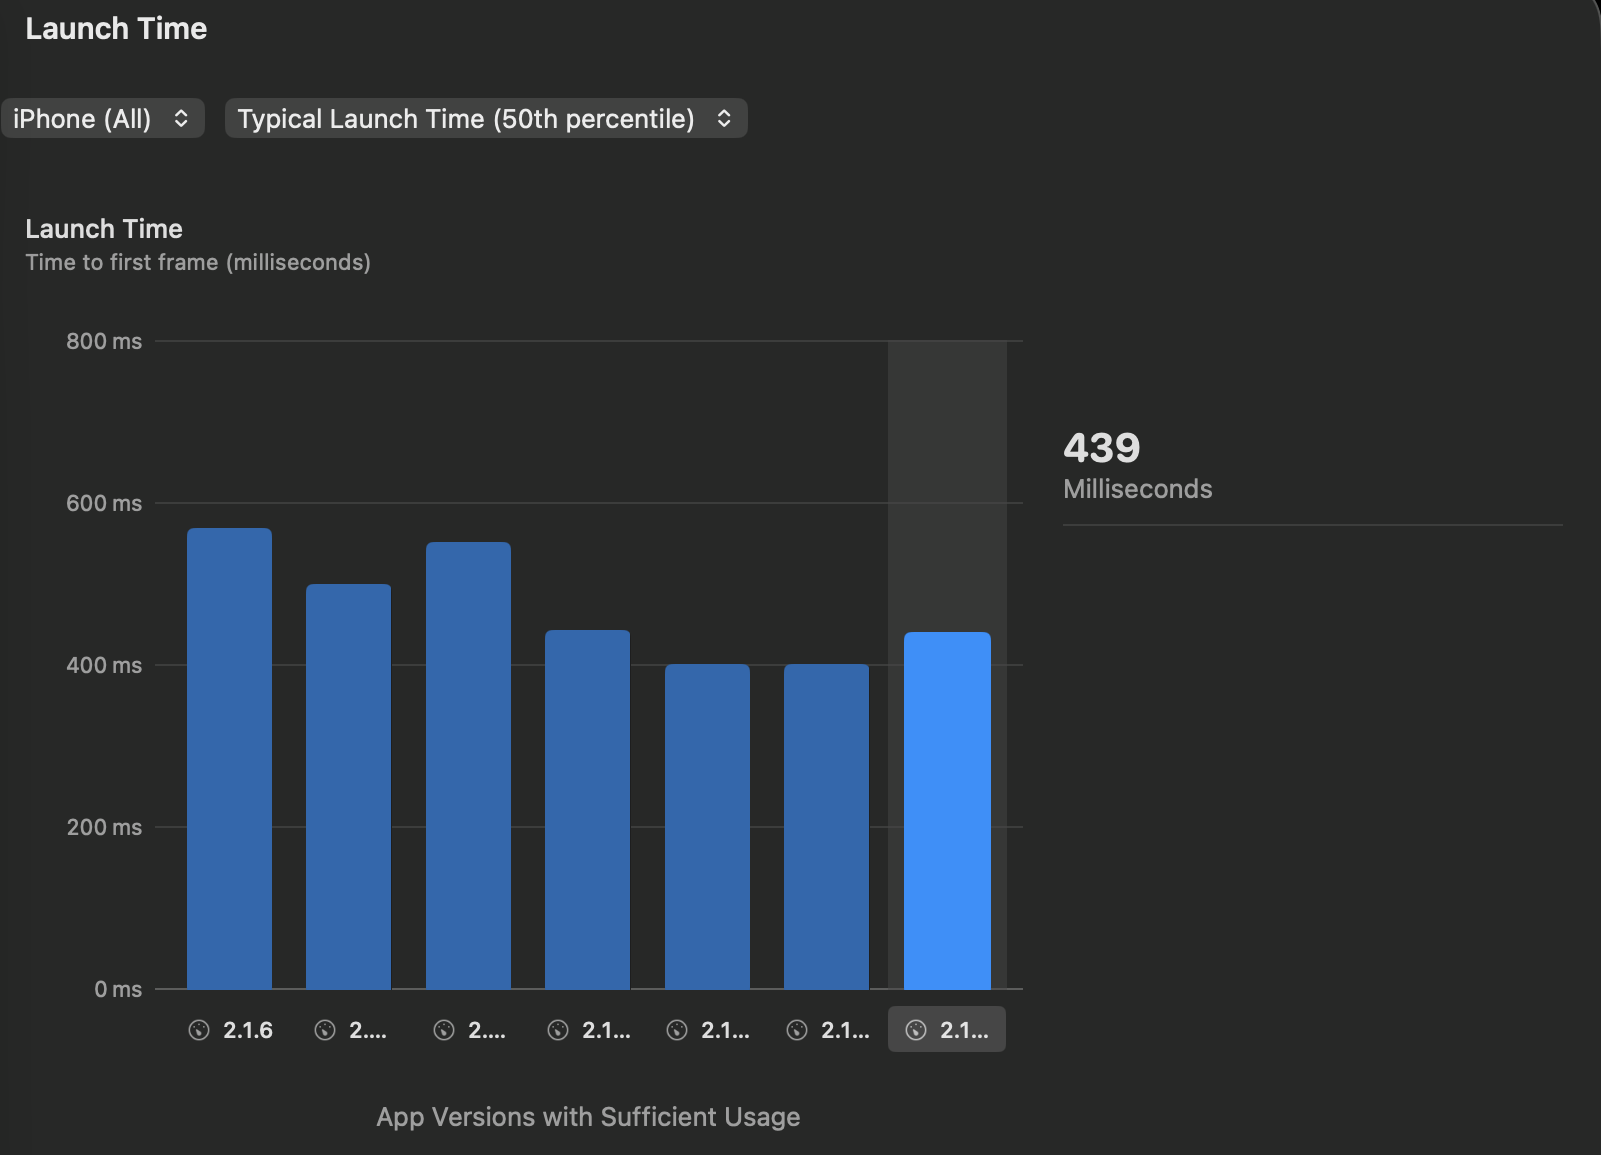
The typical launch, 50th percentile. 439 ms. This is the number that gets quoted.
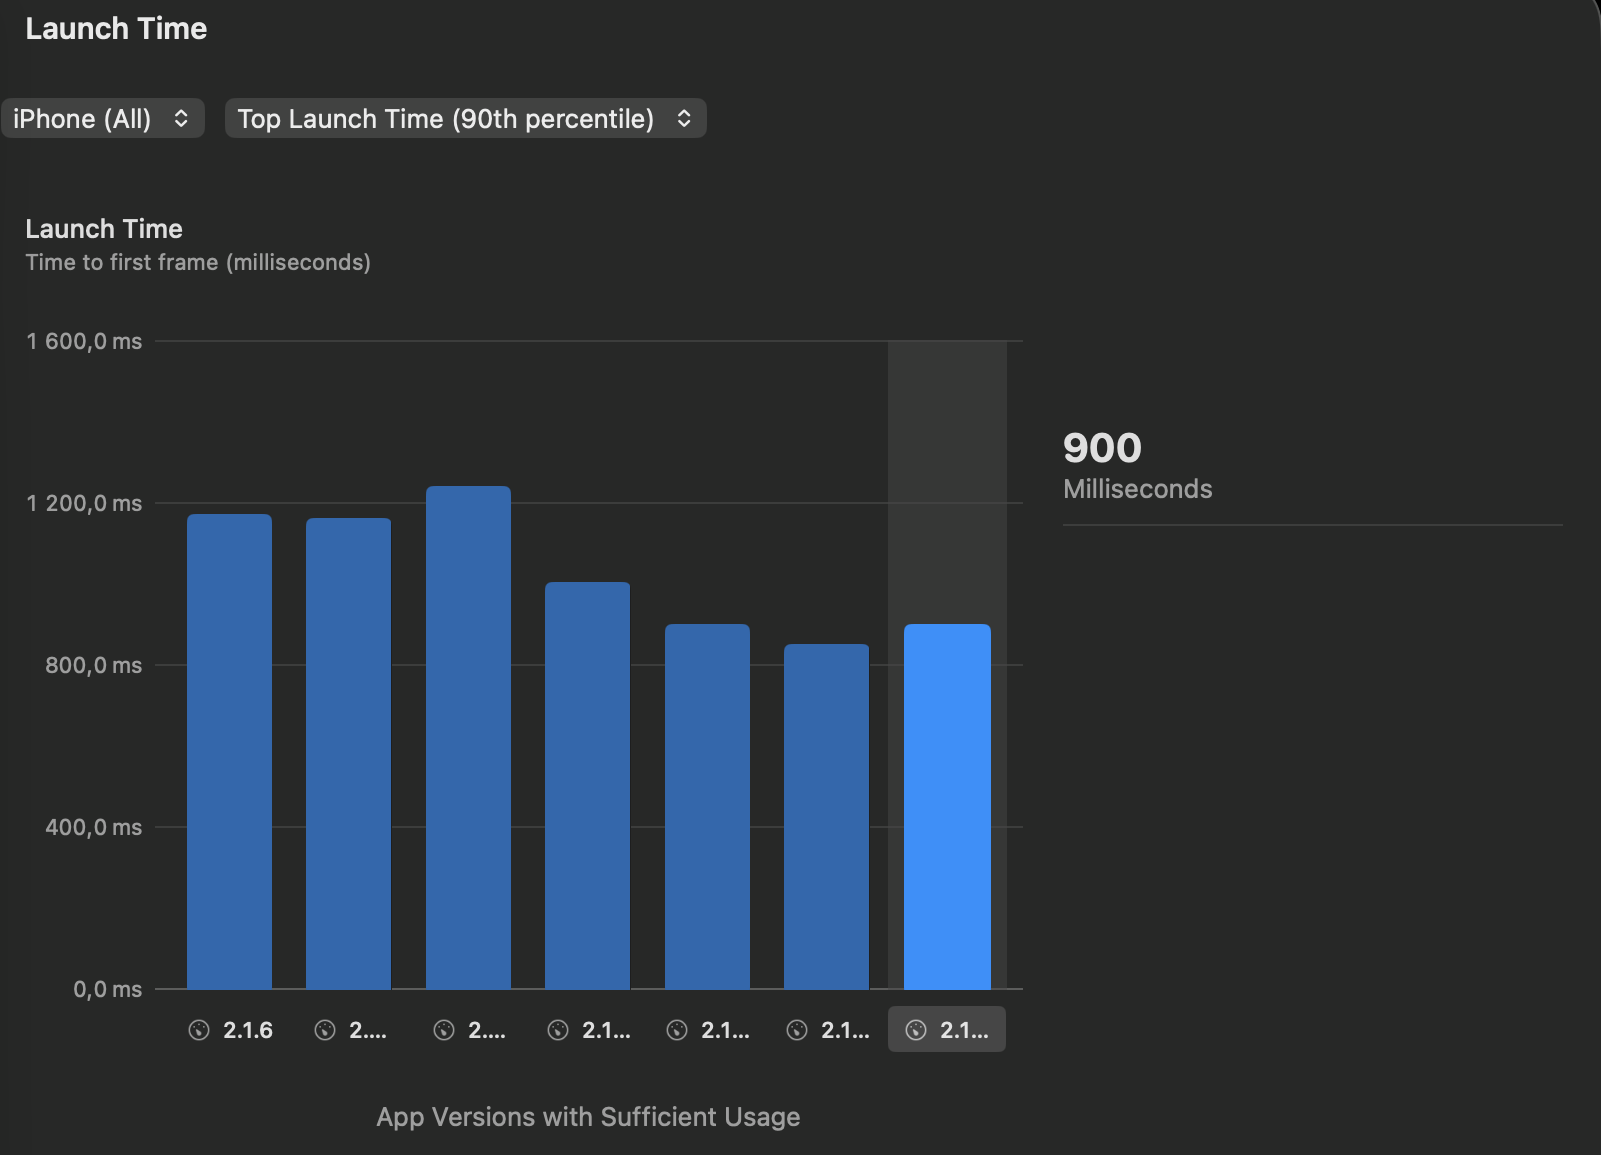
The same app, the same release, at the 90th percentile: 900 ms. Check the y-axis before you compare the bars: it has quietly doubled from 800 ms to 1600 ms, which is how two charts of near-identical shape end up telling opposite stories. One launch in ten takes more than twice as long as the number above it.
A performance number without a percentile is a rumor. Add P99 and it becomes a bug report.
Myth 2: If the metrics are green, it feels fast
Why does my app feel slow when the metrics look fine?
You can be technically fast and still feel slow. A screen that loads in 700 ms but stays blank the whole time leaves the user wondering whether their tap registered at all, and that uncertainty is the pain, not the milliseconds.
This is the myth I care about most, so here’s the triage I run before I open a profiler. Three questions, in order:
- Did we acknowledge the tap? (time to first feedback)
- Did we show something meaningful fast? (time to first content)
- Did we keep moving? (no mid-interaction stalls)
Most “the app is slow” tickets die at question 1 or 2, and neither one is a CPU problem. A skeleton view, a transition, or progressive rendering (title and price now, reviews when they arrive) makes the identical workload feel dramatically faster.
A few things follow from that:
- Optimistic UI, but only for reversible actions. Likes, bookmarks and favorites can update instantly. Payments, or anything you can’t cleanly undo, should never fake success.
- Prefetch before the wall. Start loading page n+1 while the user is still a few cells short of the end, so they never stare at nothing.
- Sometimes you actually want visible work. If “analyzing your profile…” returns instantly, people trust it less; a little honest latency reads as competence. Buell and Norton at Harvard Business School named this the labor illusion: across five experiments, people preferred services that visibly worked for an answer over ones that returned the identical answer instantly. This one still feels wrong to me every time I ship it, and it still tests better.
I think of this as a perceived-performance budget sitting right next to the frame budget: every interaction owes the user feedback inside about 100 ms (the Nielsen Norman Group threshold for “instant”, which has aged remarkably well), whether or not the real work is anywhere near done. Blow that budget and nobody cares how fast the backend was.
In plain terms: A perceived-performance budget is a limit on how long an interaction can go without visible feedback, independent of how long the real work takes. The usual ceiling is around 100 milliseconds — the point at which a response stops feeling instant. Miss it and the app feels slow even when it is fast.
Myth 3: SwiftUI’s diffing is the bottleneck
Is SwiftUI diffing slow?
When a SwiftUI screen janks, “diffing” gets blamed first. It’s almost always innocent. The real culprits are usually (a) too many updates firing, or (b) a view doing work it has no business doing.
Diffing only gets expensive when you make the view structure unstable, and the classic way to do that is the clever conditional modifier that gets reposted every few months:
// Looks clean. Quietly destroys view identity.

TextField("Name", text: $name)
    .if(isEditing) {
        $0.foregroundStyle(.blue)
    }
Because the two branches produce different types, .if almost always ends up erasing to AnyView or returning a differently-shaped tree. When isEditing flips, SwiftUI can read those as two different views and tear the old one down. The symptom is the one you’ve probably already hit: the keyboard dismisses itself mid-word and the field forgets what it was doing. That’s not the framework misbehaving. You changed its identity.
The other big one is work living inside body:
// ❌ sorting/formatting on the render path runs every update
// and hits the frame budget
var body: some View {
    List(items.sorted(by: score).map(format)) { row in RowView(row) }
}
Body looks like a description, but it’s executable code on the update path. Do the transform when the data changes and hand body something render-ready:
// ✅ prepare once, render dumb
struct FeedRow: Identifiable {
    let id: UUID
    let title: String
    let priceText: String
}

@Observable final class FeedModel {
    private(set) var rows: [FeedRow] = []

    func ingest(_ items: [Item]) {
        rows = items.sorted(by: score).map(FeedRow.init)
    }
}
My rule of thumb: boring SwiftUI outperforms clever SwiftUI. Stable identity, small views, no logic in body. And reach for Equatable on views only with evidence in hand, because a hand-written == can swallow legitimate updates and ship you a bug considerably worse than the jank you were chasing.
Moving that work into the model raises the next question: how the model keeps its loading and error state honest across every exit path, including the ones you add six months later. A single deferred cleanup line settles it — I wrote that one up on my personal blog.

Myth 4: UIKit is deprecated
Is UIKit deprecated in 2026?
Every year the same read: fewer UIKit sessions at WWDC, therefore UIKit is on the way out. But deprecated means Apple is telling you to stop because the thing is going away, and that’s not what’s happening here.
UIKit is still getting new APIs, still powering Apple’s own flagship apps, and — the part people forget — still carrying SwiftUI on iOS. Your SwiftUI hierarchy is hosted inside UIKit, and several of its workhorse views are UIKit underneath. List has been backed by UICollectionView for a few releases now. That’s an implementation detail Apple is free to change. But it’s a useful reminder that there’s a layer between your List and the collection view doing the scrolling — which is exactly why a lean UIKit implementation can still win on the hardest screens.
So where do I still reach for UIKit? Deep, dynamic, unpredictable scroll surfaces:
- Infinite feeds with prefetching and multiple data sources
- Backend-driven UI, where you don’t know the layout tree until runtime
- The genuinely hot path, where frame-based layout beats Auto Layout (and yes, “UIKit” doesn’t have to mean Auto Layout)
Everything else (forms, settings, static screens, the reusable component library) is SwiftUI’s home turf, and the previews-and-composition workflow is a real productivity win there. The mistake was never picking one. The mistake is treating the choice as a religious war instead of a routing decision: ask what this screen’s requirements point at, not which framework looks better on a job ad.
The hybrid app isn’t a transition state you should be embarrassed about. It’s the correct architecture.
Myth 5: Move it off the main thread and it’s fixed
Does moving work off the main thread fix performance?
This is the one that cost me the most time to unlearn. You find a heavy operation on the main thread, wrap it in a Task or push it onto a background queue, watch the hang disappear, and conclude you fixed the performance problem.
You didn’t. You moved it.
// The work is now off the main thread. The device still does all of it.
Task.detached {
    let decoded = await heavyDecode(payload) // same CPUs, same cost
    await MainActor.run {
        self.rows = decoded
    }
}
The same cores execute the same instructions, so scrolling can still stutter on a slower device. You’ve only changed which thread is blocked. The failure mode gets worse if you reach for GCD and fan this out per cell: dozens of blocked DispatchQueue.global() work items become dozens of real threads, and a 4-core device spends measurable time context-switching between them. Swift’s cooperative pool caps thread count and saves you from that particular disaster, which is genuinely good news, and also does nothing about the fact that the work is still being done.
Two things actually help:
- Reduce the work instead of relocating it. Nearly every real win I’ve had came from subtraction (deleting a pass, caching a result, decoding once instead of per-frame) rather than from finding somewhere else to put the same computation.
- Know which lever you’re pulling. Concurrency buys responsiveness: the main thread stays free for input. Parallelism buys throughput: CPU-bound work finishes sooner across cores. “Async” isn’t a synonym for “fast,” and for the I/O-bound work most apps actually do, adding more concurrency rarely moves the number at all. And if you are reaching for Task to get there, its capture semantics are not what most people assume. That is its own rabbit hole, and I went down it in a separate post on weak self in Swift Tasks, also on my personal blog.
Backgrounding a slow function makes the UI feel better while the battery keeps paying full price.
Myth 6: Instruments will show you the cause
Can Instruments find production performance bugs?
Instruments is superb, as long as you can reproduce the problem locally and you already know which path to profile. Both of those conditions fail constantly.
Real performance work is detective work, and mine looks something like this:
- Never trust the first explanation. The obvious suspect is usually innocent.
- One hypothesis, one variable, measured before and after. Change five things and you’ve learned nothing.
- If you can’t reproduce it, you can’t fix it, so force the conditions: oldest supported device, Low Power Mode (a fantastic stand-in for aged hardware), Network Link Conditioner.
- Symptoms live far from causes. A frozen UI can be a blocking network call. Battery drain can be a CLLocationManager that a long-dismissed screen never released.
- Write the counter-hypothesis down before you measure. It’s much harder to quietly fool yourself once “if I’m wrong, the timeline will show X” is sitting there in writing.
And when the bug only exists in production, reach past Instruments for MetricKit, which reports aggregated energy, hang and launch data from real devices. That zombie-location-manager bug is the perfect example: never reproduces on your desk, completely obvious the moment you look at location activity in production.
One habit that pays for itself: label your own suspects so the profiler has something to find. Since iOS 15, OSSignposter does the wrapping for you, and it costs essentially nothing when you’re not recording.
import OSLog

private let perf = OSSignposter(
    logHandle: OSLog(subsystem: "com.yourapp.perf",
                      category: .pointsOfInterest)
)

// Shows up as a named interval on the Points of Interest track.
let rows = perf.withIntervalSignpost("BuildFeedRows") {
    model.makeRows(from: items)
}
Ten minutes of signposting a suspicious code path turns “somewhere in here is slow” into a labeled block on the timeline. Here is what that looked like the last time I did it, on a paginated list I was convinced I understood:
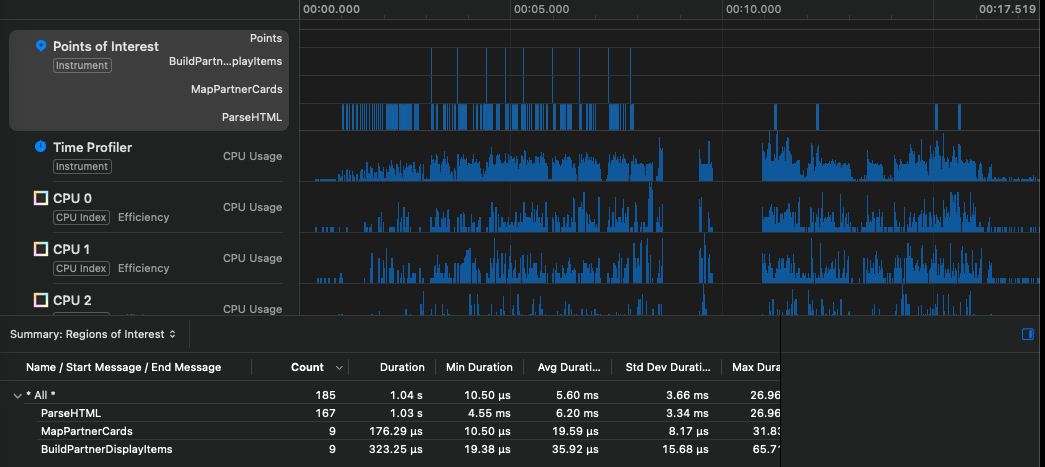
I instrumented the two things I was sure were slow: the per-page model mapping and the display-item rebuild. Together: 0.5 ms across 18 calls. The third interval, wrapped around an NSAttributedString(html:) call I hadn’t suspected at all, cost 1.03 s across 167 calls, an average of 6.2 ms each, or 37% of a frame, once per cell.
The two rows I cared about are the near-empty ones. The obvious suspect was innocent, and the profiler only told me so because I had labeled both. A profiler is only as smart as the questions you’ve labeled for it.

The refrain
If one idea threads all six myths together, it’s this: performance is a UX contract, not a benchmark. What matters is whether the app feels alive in someone’s hand on a tired iPhone 12 with two bars on a train, not the color of the tile on your dashboard.
The checklist I actually run before calling a screen “fast”:
- First feedback within ~100 ms of the tap
- Meaningful content before the full data load completes
- Stable identity on every list row and conditional view
- Zero sorting or formatting inside body
- Profiled on the minimum supported OS, on real hardware, in Low Power Mode
- P95/P99 and hitch rate checked, not just the average
- MetricKit wired up for the bugs your desk will never see
And the principle worth ending on, because it’s the truest one here: most optimizations come from subtraction, not addition. The fastest code is the work you talked yourself out of doing.
FAQ
What is a good launch time for an iOS app?
Apple’s guidance, from the Optimizing App Launch session at WWDC19, is that an app should be ready for interaction within around 400 milliseconds. The more useful question is which percentile you are measuring: a 439 ms median tells you nothing about the tenth user, whose launch may take twice as long. Judge launch time at P90 and P99, not at the median.
Why does my app feel slow when the metrics look fine?
Because users read the interface, not the dashboard. A screen that loads in 700 ms but stays blank the whole time feels slower than one that loads in 900 ms and acknowledges the tap immediately. If an interaction gives no visible feedback within about 100 milliseconds, it feels slow regardless of what the timer says.
Is SwiftUI slower than UIKit?
Not inherently. SwiftUI screens usually jank because of unstable view identity or work running inside body, not because diffing is expensive. UIKit still wins on deep, dynamic, unpredictable scroll surfaces — infinite feeds, backend-driven layouts, genuinely hot paths. For forms, settings and component libraries, SwiftUI is faster to build and fast enough to ship.
Is UIKit deprecated?
No. UIKit still receives new APIs, still powers Apple’s own flagship apps, and still hosts SwiftUI on iOS — your SwiftUI hierarchy runs inside UIKit. Fewer WWDC sessions is not a deprecation signal. A hybrid app that routes each screen to the right framework is the correct architecture, not a transition state.
Does moving work off the main thread make an app faster?
It makes the app more responsive, not faster. The same cores still execute the same instructions, so the device pays the same cost and the battery pays it too. Concurrency buys responsiveness; parallelism buys throughput. The only reliable win is reducing the work — caching a result, deleting a pass, decoding once instead of per frame.
What is hitch rate and why does it matter more than FPS?
Hitch rate measures how often frames arrive late, rather than how many frames render per second. An app can average 58 FPS and still feel broken, because the hand notices inconsistency, not throughput. Frame pacing is what users experience; average frame rate is what dashboards report.

About the author
Danylo Dyachok is an iOS Developer at NERDZ LAB, based in Lviv, Ukraine. Over five years he has shipped consumer iOS products across a wide range of domains — fitness apps, security software, music players and more — working in Swift, SwiftUI and UIKit. He cares about clean architecture, smooth animations, and apps that feel right in the hand, and he writes about Swift, architecture and the lessons that come out of shipping apps — including why to stop using weak self in Swift Tasks, using defer to tame loading state in ViewModel requests, and dynamic language switching in SwiftUI.
How we approach this at NERDZ LAB
Performance is not a phase we bolt on before release. On every iOS engagement we profile on the minimum supported OS and on real hardware, set a perceived-performance budget alongside the frame budget, and wire up MetricKit before launch so the bugs that never reproduce on a developer’s desk still reach us.
If you are building or scaling an iOS product and the app feels slower than the numbers say it is, we can help. See our mobile application development services, browse our case studies, or get in touch.
Get more insights:
See all